Ready to grow your digital business with systems, automation & AI?

AI Business Intelligence & Reporting System

OhmGenius · Ready-to-Implement AI Solution

AI BUSINESS INTELLIGENCE & REPORTING SYSTEM

Turn scattered data into clearer decisions.

Connect relevant business data, monitor useful KPIs and create automated reports with AI-assisted summaries — so owners and managers understand performance without chasing spreadsheets.

Connected dashboardsAutomated KPI reportsAI-assisted insightsManagement visibility
AI Business Intelligence & Reporting System in a business setting
Illustrative workflowExample
Business data flows from selected sources
KPIs are checked and displayed in a dashboard
AI drafts a performance summary for review
Defined implementation scope Team training & handover START / GROW / SCALE
01 / The business challenge

Business decisions are harder when the numbers are scattered.

When sales, marketing, service and operations reports live in separate tools, it takes too long to learn what is improving and what needs attention.

01
Scattered reports

Teams export figures manually from unrelated tools.

02
Conflicting KPI definitions

Different teams use different calculations for the same metric.

03
Delayed visibility

Leaders wait for weekly or monthly spreadsheet updates.

04
Missed patterns

Trends and exceptions get buried in rows of data.

Areas of improvement

Make business processes more connected.

Shared KPI visibility

Use documented metrics in one clear management view.

Less manual reporting

Schedule permitted data refreshes and recurring reports.

Faster exception review

Spot changes, gaps and unusual patterns sooner.

Better-informed decisions

Combine dashboards with AI-assisted written summaries.

Outcomes depend on access, data quality, process readiness and adoption. Results are measured, not guaranteed.

02 / How it works

From business data to actionable reporting.

Transform selected records into validated metrics, understandable dashboards and reviewable insights.

01 · Data sources

Bring in approved sales, marketing, CRM or operations data.

02 · Prepare & validate

Clean formats, join fields and agree KPI definitions.

03 · KPI dashboard

Visualize trends, targets, funnels and business outcomes.

04 · AI summary

Draft business-language explanations grounded in the data.

05 · Management review

Share reports, discuss actions and keep human judgment central.

Business metrics need trusted definitions.

Dashboards and AI summaries are only as reliable as their source data. We confirm calculations, access and limitations with your team.

03 / Capabilities and deliverables

What OhmGenius configures and delivers.

A focused, practical AI service — with digital platforms, integrations and implementation support where needed.

KPI discovery

Identify decision questions, meaningful metrics and reporting priorities.

Data source integration

Connect supported CRM, commerce, analytics, spreadsheets or operational tools.

Dashboard setup

Build management views with relevant filters and comparisons.

Automated reports

Configure scheduled summaries and selected alerts where tools permit.

AI-assisted insights

Generate draft observations with review and data-grounding safeguards.

Governance & training

Document metric definitions, permissions, refresh rules and owner responsibilities.

Included implementation outputs

Final deliverables are confirmed in the written scope.

  • KPI dictionary
  • Data connection and refresh plan
  • Management dashboard
  • Scheduled report template
  • Validation and review checklist
  • Team training and handover
04 / Suitable industries

Business reporting that reflects your industry KPIs.

Choose the questions that matter to your business rather than trying to measure everything at once.

A tailored discovery session identifies the workflows with the strongest potential return.

Industry applications of AI Business Intelligence & Reporting System
Industry-specific AI applications

How This Works for Different Industries

Read the examples below to see the actual tasks this system may help your business manage.

01 / 10

Ecommerce & D2C

See the complete ecommerce performance story.

What we can do
  • Monitor orders, AOV and repeat purchase trends
  • Compare acquisition spend with conversion data
  • Track product and category performance
BEST FORD2C brands and online shops
02 / 10

Marketplaces

Measure both buyer and seller health.

What we can do
  • Track GMV, orders and active sellers
  • Compare category and vendor contribution
  • Report seller fulfillment and operational exceptions
BEST FORDigital marketplaces and multi-vendor platforms
03 / 10

SaaS & Software

Understand acquisition and recurring growth.

What we can do
  • Monitor trials, activation and conversion
  • Track MRR, churn and retention where data supports
  • Create management cohort and funnel reporting
BEST FORSaaS founders and product teams
04 / 10

Retail & Wholesale

Compare stores, customers and products.

What we can do
  • Track branch or category sales performance
  • Monitor stock movement and replenishment indicators
  • Review wholesale order and dealer trends
BEST FORRetailers, distributors and wholesalers
05 / 10

Education & Training

Improve admissions and learner operations visibility.

What we can do
  • Track enquiry-to-admission conversion
  • Compare program demand and enrollment trends
  • Report marketing channels and operational KPIs
BEST FORInstitutes and online education businesses
06 / 10

Professional Services

Understand pipeline and service performance.

What we can do
  • Track leads, proposals and project pipeline
  • Monitor delivery and utilization indicators
  • Summarize client or service profitability where available
BEST FORConsultants, agencies and B2B service firms
07 / 10

Manufacturing

See production and business performance together.

What we can do
  • Report throughput, downtime and delays
  • Compare order and procurement performance
  • Track capacity and exception trends
BEST FORIndustrial suppliers and manufacturers
08 / 10

Logistics & Distribution

Monitor service and fulfillment performance.

What we can do
  • Track delivery completion and exception rates
  • Compare routes, clients and operational costs
  • Summarize recurring shipment issues
BEST FORLogistics and distribution businesses
09 / 10

Real Estate

Monitor project and sales activity.

What we can do
  • Track enquiry, visit and booking funnel
  • Compare project performance and inventory stages
  • Review agent and campaign reports
BEST FORBuilders, property consultancies and agencies
10 / 10

Healthcare Administration

Report non-clinical service operations.

What we can do
  • Track appointment and staffing activity
  • Monitor service enquiries and administrative backlog
  • Create access-controlled operational summaries
BEST FORClinics and wellness service administration

Start with one real business problem.

We assess the current workflow, required integrations and human review, then propose a suitable implementation scope.

Discuss Automation for My Industry →

All reports depend on accessible data, documented metric definitions and appropriate privacy or regulatory controls. These are illustrative use cases; not every feature is included in every package.

Choose an implementation level

AI STARTFocused starter

For founders who need clarity on a few essential KPIs.

AI GROWConnected growth

For teams tracking performance across business functions.

AI SCALEAdvanced scope

For larger organizations with more complex reporting.

05 / Packages

AI START, AI GROW and AI SCALE

Select a reporting scope based on the number of sources, dashboard complexity and management requirements. Individual quotations are shared privately.

AI START

Personalized quotation

For founders who need clarity on a few essential KPIs.

  • 1 primary data source
  • Essential KPI definition
  • 1 management dashboard
  • Basic periodic report
  • User handover and training
Indicative delivery: 14–21 days
Request START Proposal

AI SCALE

Personalized quotation

For larger organizations with more complex reporting.

  • Multi-source integration assessment
  • Advanced KPI dashboards and filters
  • AI-assisted management review workflows
  • Data quality and access governance
  • BI enablement and handover
Indicative delivery: 45–60 days
Request SCALE Proposal
Private quotations: We share package prices individually after understanding your requirements. Software licenses, AI/API usage, messaging fees, hosting, custom connectors, GST and optional ongoing support are quoted separately where relevant. Indicative timelines depend on access and approvals.
06 / Implementation process

Clear milestones. Practical delivery.

We begin with your current process and target outcome, then select appropriate AI and digital systems.

STEP 01

Define decisions

Choose management questions, KPIs, owners and baselines.

STEP 02

Review data

Assess source quality, access methods and calculation rules.

STEP 03

Build & validate

Connect sources, design dashboards and test numbers.

STEP 04

Train & review

Agree refresh schedules, hand over and review insights.

START · 14–21 daysGROW · 30–40 daysSCALE · 45–60 days

Timelines are indicative and depend on data, tool availability, access and scope.

ILLUSTRATIVE KPI REPORTING FLOW
Data sources
Commerce, CRM and marketing inputs
Connected
KPI check
Orders, revenue and conversion definitions
Validated
Dashboard
Trends, funnels and period comparisons
Visible
AI narrative
Draft summary of changes and exceptions
Review
Manager action
Owner decides next steps and priorities
Actionable
07 / Demo and solution example

Explore a clear weekly business performance view.

A representative dashboard walkthrough shows how raw sources become useful, reviewable management information.
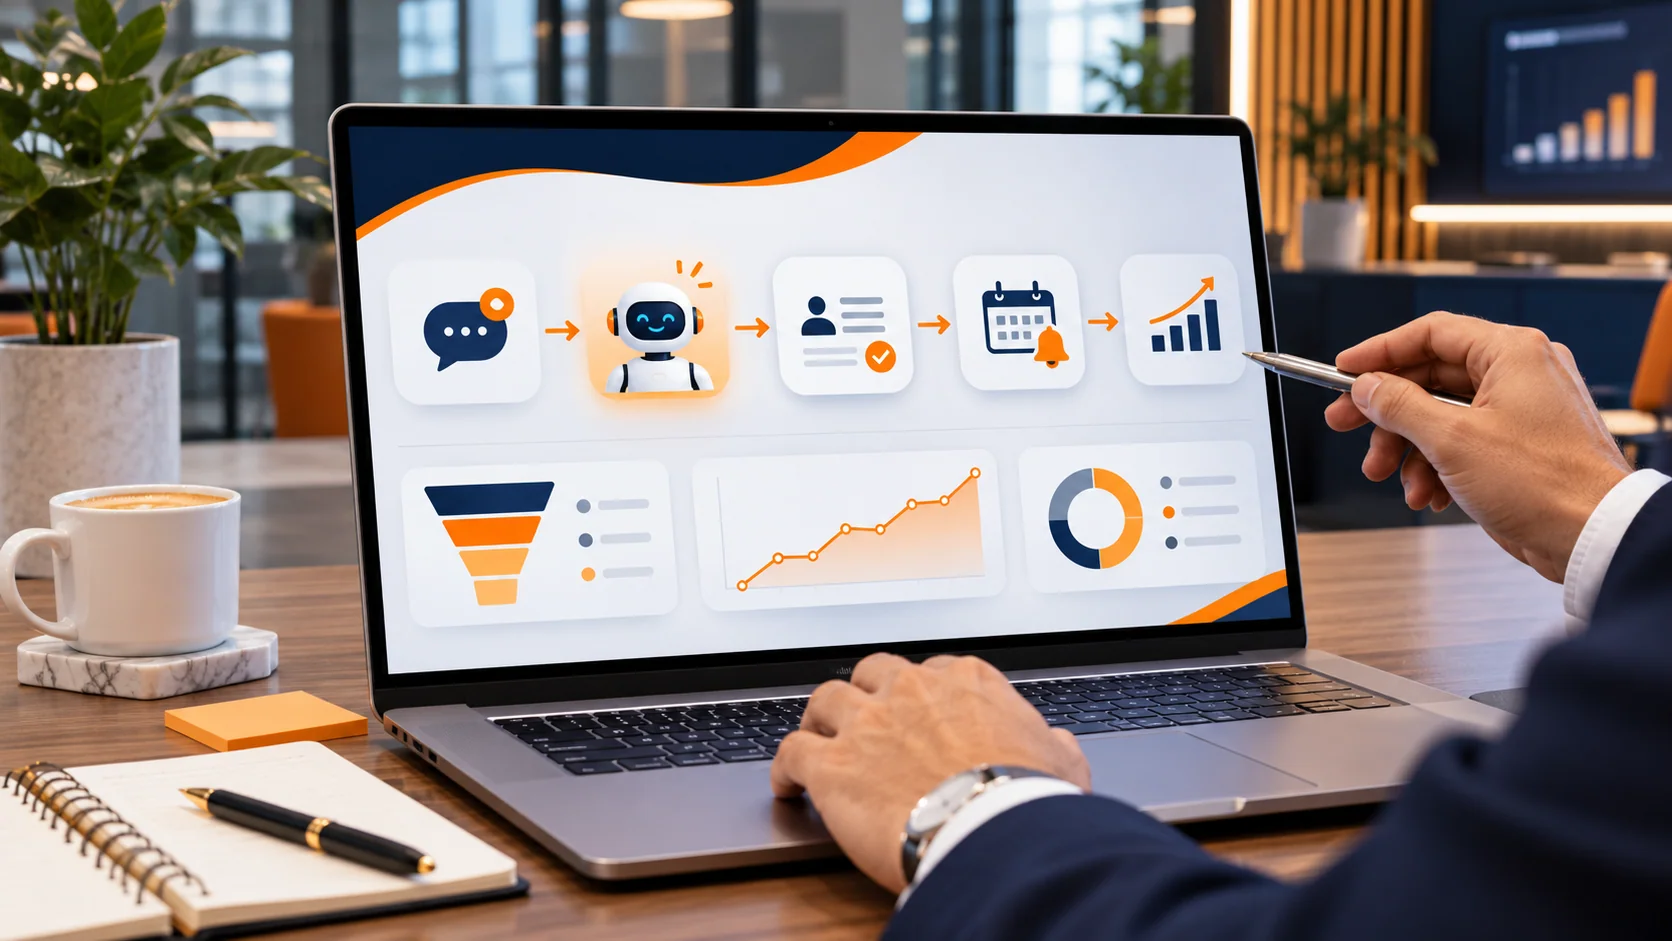
Transparency: This is a representative example, not a live customer record or a claim of validated improvement. Actual outcomes are confirmed after implementation and measurement.
Professional work environment representing a AI Business Intelligence & Reporting System demonstration
See the approach in practice

Business-first planning, then the right AI implementation.

OhmGenius combines advisory, integration coordination and practical implementation support. Review the example workflow, then discuss how the architecture would need to change for your business.

View BI Solution Showcase →
08 / Frequently asked questions

Questions before you get started.

Understand how this offering works, what it includes and how to decide your first implementation scope.

Do I need a separate data warehouse?

Not necessarily. Small reporting projects may connect directly to supported sources. More complex data volumes and governance can require a warehouse or managed data layer.

Will AI make business decisions automatically?

No. AI can assist with summaries and questions, while managers verify the data and make decisions.

Which tools can you connect?

Common commerce, CRM, analytics and spreadsheet tools may be possible. Compatibility, API access and licensing are assessed first.

How often is the dashboard refreshed?

Refresh frequency depends on the source API, integration method, licenses and agreed system design. Real-time reporting is not assumed.

Will the dashboard be accurate?

We verify calculations and disclose source limitations, but results depend on the completeness and quality of the underlying data.

Do you include reporting software costs?

No. Third-party subscriptions, hosting, API use, applicable taxes and custom connectors are priced separately if required.

Can the dashboard grow as our business expands?

Yes, subject to the chosen architecture and a revised scope for additional sources, metrics or users.

09 / Discuss your business needs

Start with a clear problem. Build the right AI solution.

Explain the tools you use today, where your team is losing time and which results matter. OhmGenius will help define a focused starting scope.

Individual implementation package prices are shared privately after discovery.

Prepare for your consultation

Your current tools and processes
Approximate process or enquiry volume
Biggest manual bottleneck
Important data or approval constraints
Your business target and preferred timeline

OhmGenius — AI & Digital Business Transformation · AI-first business solutions supported by digital implementation. Photos are illustrative.